Very appreciated for your nice detail on AAS and other factor such as Wait,
IO, end user's experience and so on, Denis 😉 ! It seems like I have deeper
understanding on AAS (it's a constant value) than before.
I am very sorry that my real intention is that I wanna estimate *MAXIMUM
CONCURRENT CONNECTIONS* (it might make me confusion about the combination
graph with AAS and Logic CPUs from EMCC, I suddenly realized that it's
possible to have some relationship on AAS and CPUs due to the *RED LINE* of
Logic CPUs but actually they have no any relationship.
Yes, I'm not sure about the maximum processes (affordable value for my
oracle database server) in v$parameter thus I need to estimate *maximum
concurrent connections*. Eventually it makes no sense that I know
estimating the value of *MAXIMUM ACTIVE SESSIONS*.
By the way if CPU load (press *W* from my keyword on Linux then you'll find
out it) increases to *192* at this very moment the current concurrent
connections is the maximum concurrent connections (select count(*) from
v$session) ?
Best Regards
Quanwen Zhao
denis.sun@xxxxxxxxx <denis.sun@xxxxxxxxx> 于2021年11月9日周二 上午12:34写道:
hi, Quanwen,
If I rephrase your original question as the following:
Given the number of CPU cores or threads the database server has, can I
estimate a reasonable maximum active session value my database can have?
My answer to this particular question is that there is no relationship
between AAS and # of CPU, if AAS is constantly/frequently greater than #
CPU, that situation we need to pay attention to. It MAY indicate you have
CPU bottleneck. Whether it is reasonable or not, we need to check wait
event and end user's experience.
Suppose you have 192 CPUs, then at AAS=50, you can still get complains
that database is slow from your users. It is most likely not due to CPU
bottleneck, but could be due to I/O, network, configuration, application
lock etc; If you see AAS=500, does that mean it is bad? All depends. like
how long it lasts? Are all 500 active sessions doing CPU-intensive
workload, (on or wait on CPU)?, what are end users' expectations (SLO for
such particular workload)? etc
AAS + Wait event + end user experience/service level objective all
matters.
BTW, I certainly know the difference between "Reply' and "Reply ALL". I
cannot include previous messages is due to I use my work email to receive
Oracle-L but I am not allowed to send outside email using it (company
policy, even I cannot open yahoo email with my work PC to copy/paste
between work/personal email). you see I know how to "Rely All" with my
yahoo email account :).
Denis
On Sunday, November 7, 2021, 10:27:01 PM EST, Quanwen Zhao <
quanwenzhao@xxxxxxxxx> wrote:
Thanks for your thread, Denis 😉. You just click "Reply All" instead of
"Reply" then all of people subscribed "Oracle-L" will see our stuff from
their emails respectively. not just Google email? I see your email is from
yahoo.
Sorry, I have to clarify that my oracle database server has *192* number
of *logic CPUs* (in other words *96 cores* of physical CPUs rather than
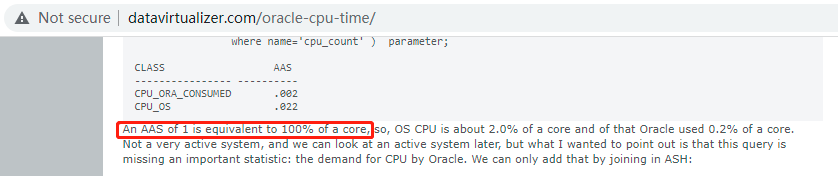
*382* you mentioned previously). By the way I just quoted
*"because an AAS of 1 is equivalent to 100% of a CPU **core"* from
*http://datavirtualizer.com/oracle-cpu-time/*
<http://datavirtualizer.com/oracle-cpu-time/>, *here*
<https://quanwenzhao.files.wordpress.com/2021/11/oracle_cpu_time.png> is
the screenshot.
At least why I cited that AAS (AAS by *per wait class* or *per
session_state and wait_class*) has any relationship to *CPU cores or
threads* because I see the below *3* graphs from EMCC.
*https://quanwenzhao.files.wordpress.com/2021/11/aas_by_per_wait_class.png*
<https://quanwenzhao.files.wordpress.com/2021/11/aas_by_per_wait_class.png>
*https://quanwenzhao.files.wordpress.com/2021/11/aas_by_per_wait_class_2.png*
<https://quanwenzhao.files.wordpress.com/2021/11/aas_by_per_wait_class_2.png>
*https://quanwenzhao.files.wordpress.com/2021/11/active_sessions.png*
<https://quanwenzhao.files.wordpress.com/2021/11/active_sessions.png>
Best Regards
Quanwen Zhao
denis.sun@xxxxxxxxx <dmarc-noreply@xxxxxxxxxxxxx> 于2021年11月8日周一 上午8:33写道:
Hi, Quanwen Zhao
because an AAS of 1 is equivalent to 100% of a CPU core
I don't think AAS has any relationship to the number of CPU cores or the
utilization of CPU core ( 100% or 0%).
AAS = Average Active Sessions
AAS = DB Time/Elapsed Time(wall clock)
DB Time = CPU Time + non-idle wait time
ie if wall clock is 15 min, accumulated DB time from all sessions during
that 15 min time period is 150 min, then AAS= 10 , it does not matter how
many CPU cores you have.
When you have 8 CPU cores and you observe you have AAS=11 or count=11 (
from select count(*) from v$session where state='ACTIVE', I imagine this
count as AAS in 1 second wall clock time, instantaneous AAS ), From what
you described, you seemed interpret this as you must have 8 sessions
on CPU 100%. This is not true completely. It can be one active session
hold a DML lock on a table row, all other 9 active sessions waiting for
this lock. nothing to do with CPU count or utilization. ( This is what
Jonathon Lewis's example tells us. sorry I cannot include
Jonathon's reply in my reply because I use different emails to
receive and send to oracle-l)
If your intended purpose is to estimate what are the maximum or reasonable
AAS your database can have. I think only empirical approach makes sense. if
you have CPU=8 then monitor from AAS=2xCPU= 16; if your CPU=192, I don'
think monitor from 382 makes sense, instead monitor from 20. Then
correlating with application metrics.
In one of our production db, we have 24 CPUs, and I receive average active
session alert greater than 200 from time to time, the system does not scale
well obviously but no one cares :) no complains, app team seems happy with
what the database deliver to them.
So I think AAS is a good metrics to monitor db but need to correlate with
other metrics. ( Look at OEM performance page, AAS with wait event in the
same graph, this is ideal)
Best regards,
Denis