Thanks for your thread, Denis 😉. You just click "Reply All" instead of
"Reply" then all of people subscribed "Oracle-L" will see our stuff from
their emails respectively. not just Google email? I see your email is from
yahoo.
Sorry, I have to clarify that my oracle database server has *192*
number of *logic
CPUs* (in other words *96 cores* of physical CPUs rather than *382* you
mentioned previously). By the way I just quoted
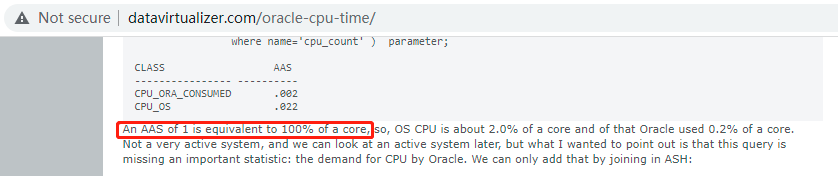
*"because an AAS of 1 is equivalent to 100% of a CPU **core"* from
*http://datavirtualizer.com/oracle-cpu-time/*
<http://datavirtualizer.com/oracle-cpu-time/>, *here*
<https://quanwenzhao.files.wordpress.com/2021/11/oracle_cpu_time.png> is
the screenshot.
At least why I cited that AAS (AAS by *per wait class* or *per
session_state and wait_class*) has any relationship to *CPU cores or
threads* because I see the below *3* graphs from EMCC.
*https://quanwenzhao.files.wordpress.com/2021/11/aas_by_per_wait_class.png*
<https://quanwenzhao.files.wordpress.com/2021/11/aas_by_per_wait_class.png>
*https://quanwenzhao.files.wordpress.com/2021/11/aas_by_per_wait_class_2.png*
<https://quanwenzhao.files.wordpress.com/2021/11/aas_by_per_wait_class_2.png>
*https://quanwenzhao.files.wordpress.com/2021/11/active_sessions.png*
<https://quanwenzhao.files.wordpress.com/2021/11/active_sessions.png>
Best Regards
Quanwen Zhao
denis.sun@xxxxxxxxx <dmarc-noreply@xxxxxxxxxxxxx> 于2021年11月8日周一 上午8:33写道:
Hi, Quanwen Zhao
because an AAS of 1 is equivalent to 100% of a CPU core
I don't think AAS has any relationship to the number of CPU cores or the
utilization of CPU core ( 100% or 0%).
AAS = Average Active Sessions
AAS = DB Time/Elapsed Time(wall clock)
DB Time = CPU Time + non-idle wait time
ie if wall clock is 15 min, accumulated DB time from all sessions during
that 15 min time period is 150 min, then AAS= 10 , it does not matter how
many CPU cores you have.
When you have 8 CPU cores and you observe you have AAS=11 or count=11 (
from select count(*) from v$session where state='ACTIVE', I imagine this
count as AAS in 1 second wall clock time, instantaneous AAS ), From what
you described, you seemed interpret this as you must have 8 sessions
on CPU 100%. This is not true completely. It can be one active session
hold a DML lock on a table row, all other 9 active sessions waiting for
this lock. nothing to do with CPU count or utilization. ( This is what
Jonathon Lewis's example tells us. sorry I cannot include
Jonathon's reply in my reply because I use different emails to
receive and send to oracle-l)
If your intended purpose is to estimate what are the maximum or reasonable
AAS your database can have. I think only empirical approach makes sense. if
you have CPU=8 then monitor from AAS=2xCPU= 16; if your CPU=192, I don'
think monitor from 382 makes sense, instead monitor from 20. Then
correlating with application metrics.
In one of our production db, we have 24 CPUs, and I receive average active
session alert greater than 200 from time to time, the system does not scale
well obviously but no one cares :) no complains, app team seems happy with
what the database deliver to them.
So I think AAS is a good metrics to monitor db but need to correlate with
other metrics. ( Look at OEM performance page, AAS with wait event in the
same graph, this is ideal)
Best regards,
Denis