[argyllcms] Re: Visualization of ti3 file
- From: Graeme Gill <graeme@xxxxxxxxxxxxx>
- To: argyllcms@xxxxxxxxxxxxx
- Date: Fri, 12 Jul 2013 17:00:08 +1000
Torsten Bronger wrote:
> I have a ti3 file containing measured colour target patch values
> from my camera and the desired values from the reference file. Can
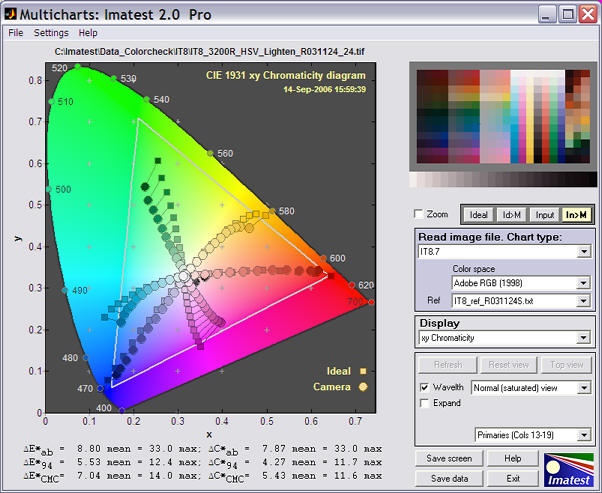
> one visualize this somehow like
> <http://www.automation-drive.com/EX/05-14-13/Multicharts_IT8_xy.jpg>?
Not quite like that no - but you can plot the delta's in 3D using
<http://www.argyllcms.com/doc/verify.html> -w flag.
Graeme Gill.
Other related posts:
