[argyllcms] Verifying profile quality of LUT-based scanner and printer profiles
- From: Milton Taylor <milton.taylor@xxxxxxxxxxx>
- To: argyllcms@xxxxxxxxxxxxx
- Date: Sun, 19 Mar 2006 23:35:45 +1100
Hi all,
Having created an apparently -qu [i.e. high quality] LUT profile for my
film scanner, it reports a very low avg dE (around 0.3) for the IT8
target slide. This sounds pretty good to me. (The peak was about 3).
But is there any way to verify the 'smoothness' of the profile? In
particular, I'm thinking about the discontinuities that might exist in
the LUT tables.
This thought came to me whilst profiling my cheap and nasty Canon i865
printer using the 'poor man's method'. (Using my Epson 2450 flatbed as a
'colorimeter'). After profiling the printer, again as a high quality LUT
profile, I printed a scan of my IT8 reflective target, and was very
amazed at how close the print is to the actual target visually.
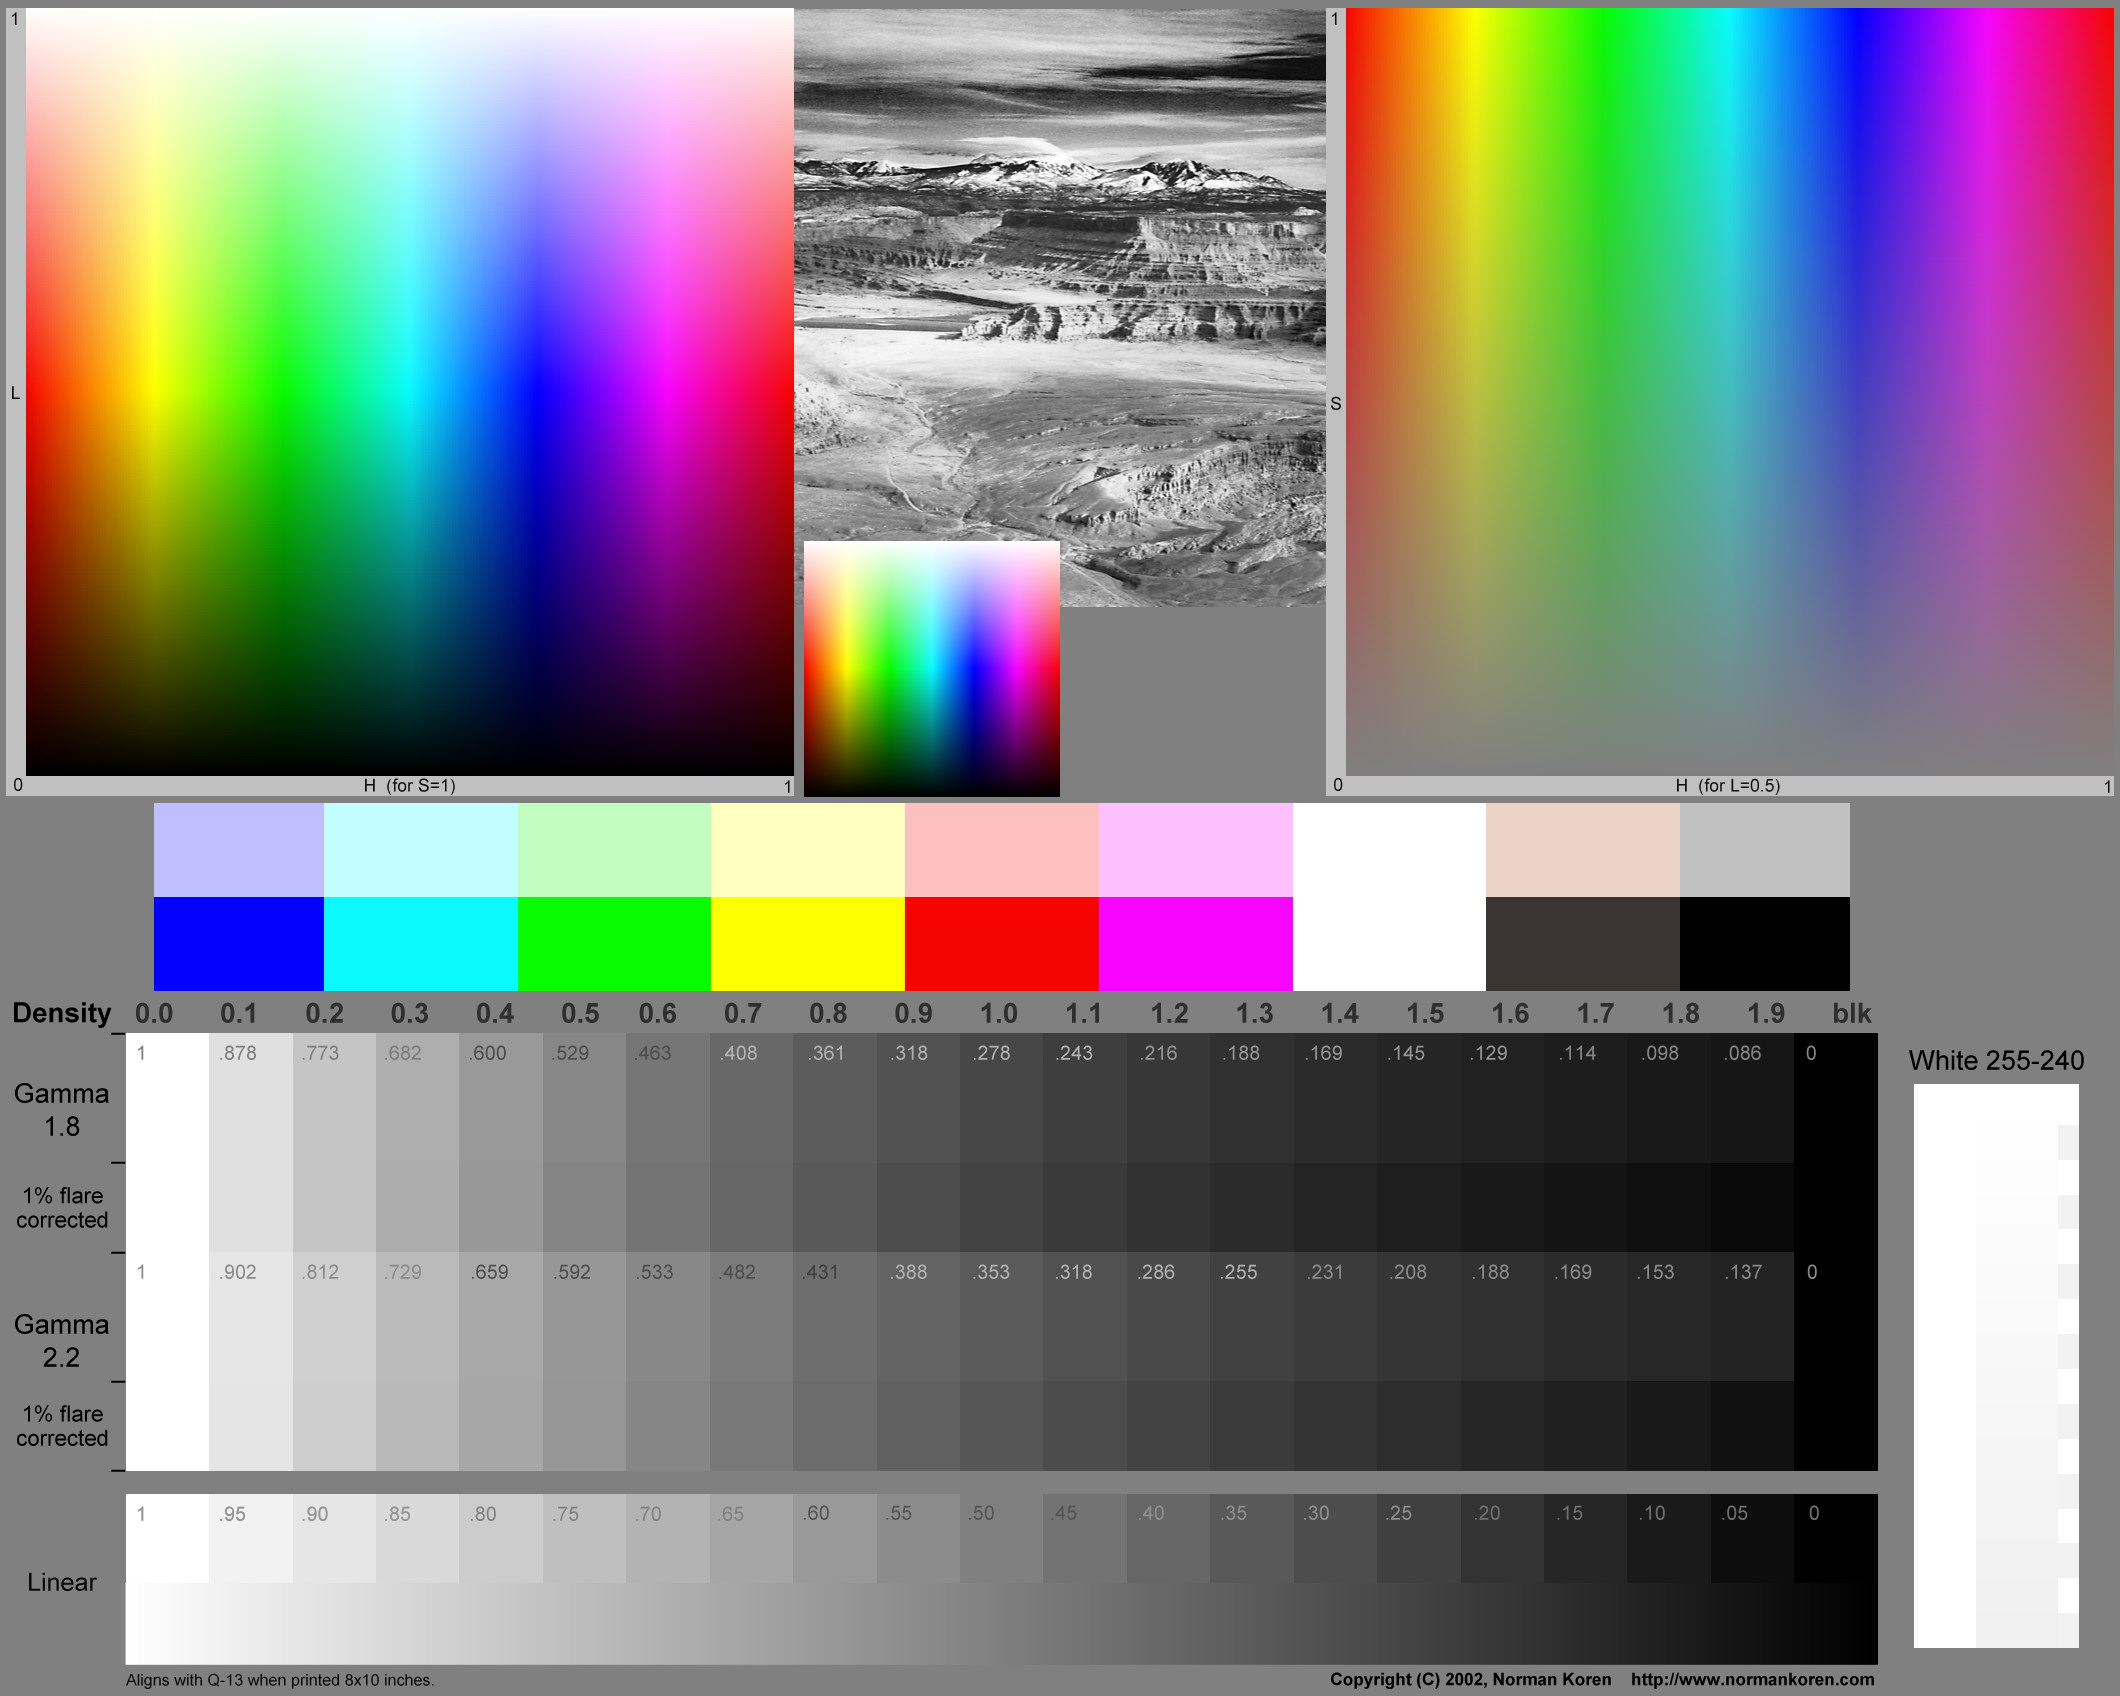
However, I then printed a different sort of test chart from Norman
Koren, both through the new printer profile and also straight to the
printer as raw unmodified RGB. (The chart is at
http://www.normankoren.com/Stepchart_large_HSL.jpg)
The one that went straight to the printer was interesting. The hues are
not evenly represented in terms of their 'share' of the 360 degree hue
spectrum. Yellows and cyans are quite skinny compared to blues, reds and
greens. However, at least it came out with very even colour progressions
and shifts in the Hue/Sat and Hue/Light charts. The colours are of
course just reflecting raw RGB inputs, so I would expect it to look
smooth, even if these are non-managed colours.
However, when printing the same chart through the new profile, (using
sRGB as the assigned source profile), the result looks pretty awful.
There are clearly serious discontinuities in the LUT tables, as you can
lots of banding and distinct edges and steps at numerous points in the
HSL charts.
Now of course, this could be due to:
(a) It being a cheap printer, with 3 dye-based inks plus photo black
(b) It being an RGB interface
(c) Using the flatbed scanner to profile the printer
So here are my questions:
1. I assume a LUT approach is always going to show discontinuities in an
HSL chart like this. Is it something to be overly concerned about? Am I
seeing something here that is much worse than normal because of (a), (b)
and (c) above? I imagine it would be a problem if you were printing
anything that had a smooth gradient in it, like a skin tone or a blue
sky...I'm sure unwanted banding would be the result. I once saw this
happen on some lab proofs from a commercial colour lab, and they
couldn't explain why it happened. But I think I can now!
2. Do commercial inkjets (such as Epson 7800, 9800) use LUT profiles or
shaper/matrix? (When I softproofed the Koren chart in Photoshop using
the Epson printer profile it looked pretty good to me).
3. How much better would the result be if I had measured the printed
charts with a real spectrophotometer?
4. How can I be sure that my film scanner profile doesn't show similar
disturbing discontinuities...is there a way to visualise this? Once
again, I'm worried about banding when it's scanning anything with a
smooth tone progression in it. Perhaps I should try making a
shaper/matrix profile for it to see what that produces.
5. Why is it not possible to produce a shaper/matrix profile for an
output profile? I assume it would have to be CMYK so that the real ink
channels were being directly controlled by the printing application.
That'll do for now...
Cheers,
Milt
Other related posts: