[obol] Swan survey data
- From: Roy Lowe <roy.loweiii@xxxxxxxxx>
- To: obol <obol@xxxxxxxxxxxxx>
- Date: Sun, 22 Feb 2015 08:09:58 -0800
The USFWS has conducted the mid-winter waterfowl survey across North
American for more than a half century and continue to do so now. An
attempt is made annually to survey all major waterfowl use area during the
first week of January across,the continent. The majority of the data is
collected by aerial surveys but some surveys are also supplemented by
ground counts. Weather can be pretty fickle in early January so the survey
can stretch over a number of weeks across the country.
These dangerous surveys do not come without costs however, as many of you
will remember we lost two of our colleagues in a crash during one of these
flights in Oregon in 2010.
You can query the data base for the mid-winter waterfowl survey data at the
following web address
https://migbirdapps.fws.gov/mbdc/databases/mwi/mwi_Query_index.asp?qryPage=4
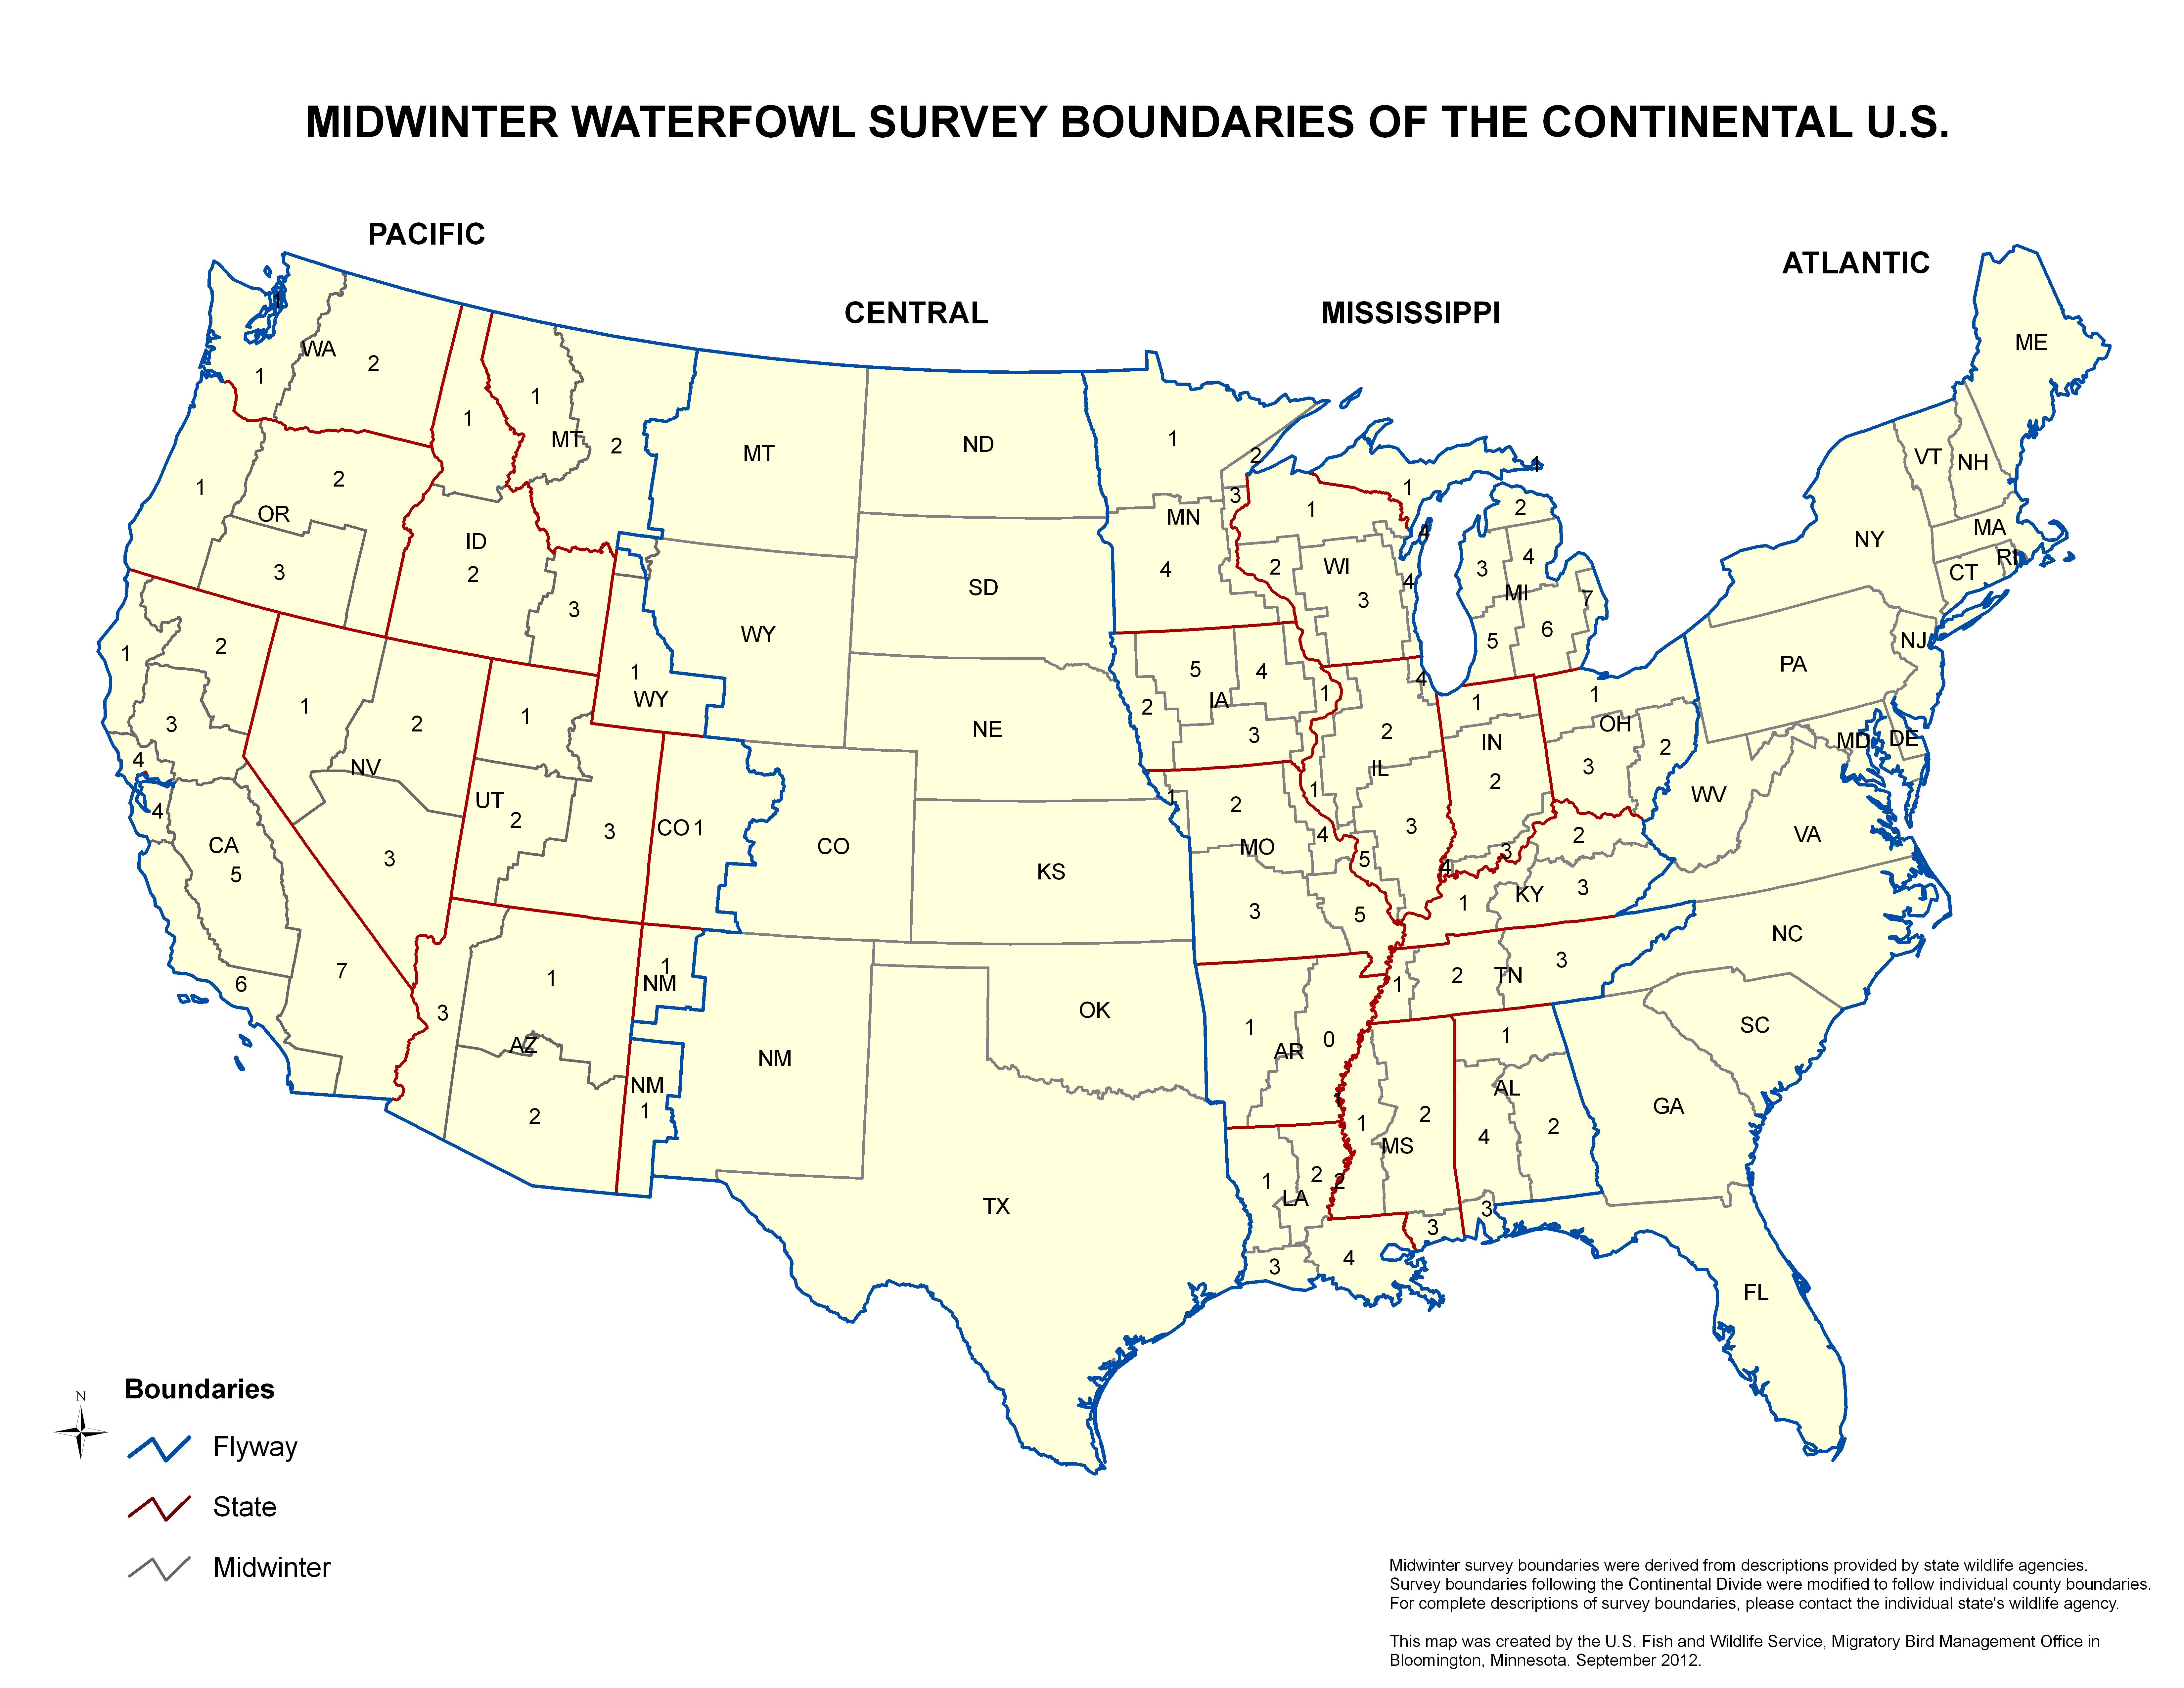
For Oregon there are three survey zones. Zone one is everything west of
the cascades. zone 2 is east of the Cascades and north of the Bend area
to the Columbia River and then there is a narrow strip along the Idaho
border all the way down to Nevada. Zone 3 is the Klamath basin, Malhuer
and Summer Lakes and ll the other habitats in this area. You can see the
survey map here
https://migbirdapps.fws.gov/mbdc/databases/mwi/MWS_AllFlyways_Map.jpg
The surveyors do not differential tundra swans from trumpeter swans which
is difficult to do in a fast moving aircraft so the data is lump. I did
some queries for 1970, 1887, and 1970 and here's he results
1970
Zone 1 1,168
Zone 2. 32
Zone 3. 1,795
Total 2,995
1987
Zone 1 5,330
Zone 2. 4
Zone 3. 4,250
Total 9,584
2013
Zone 1 2,533
Zone 2. 3
Zone 3. 462
Total 2,998
Remember, these surveys attempt to count all major waterfowl use areas in
each state but is in no way considered a complete count but more of a
population index.
Roy
Other related posts:
- » [obol] Swan survey data - Roy Lowe
