In your case you can easily compare the stats from the dba_hist_sqlstat and
compare the good and bad execution plan then validate it with ASH
(SQL_PLAN_LINE_ID, SQL_PLAN_OPERATIONS, SQL_PLAN_OPTIONS) then in this case
you’ll be able to clearly tell which indexes are used or not but this will
not tell you if it’s dropped or if something has changed on the
environment.
If you’d like to know the changes on the before and after then you can use
SQLT-compare http://karlarao.tiddlyspot.com/#SQLT-compare. You can just
pull the good and bad plan hash values and then execute the compare then it
will highlight in red the missing indexes in your case.
If let’s say your scenario is just spinning on CPU and the ASH is just
telling you the SQL_ID is just 100% on CPU. Then just use snapper and
pstack. And you can compare/profile the good and bad sessions. The commands
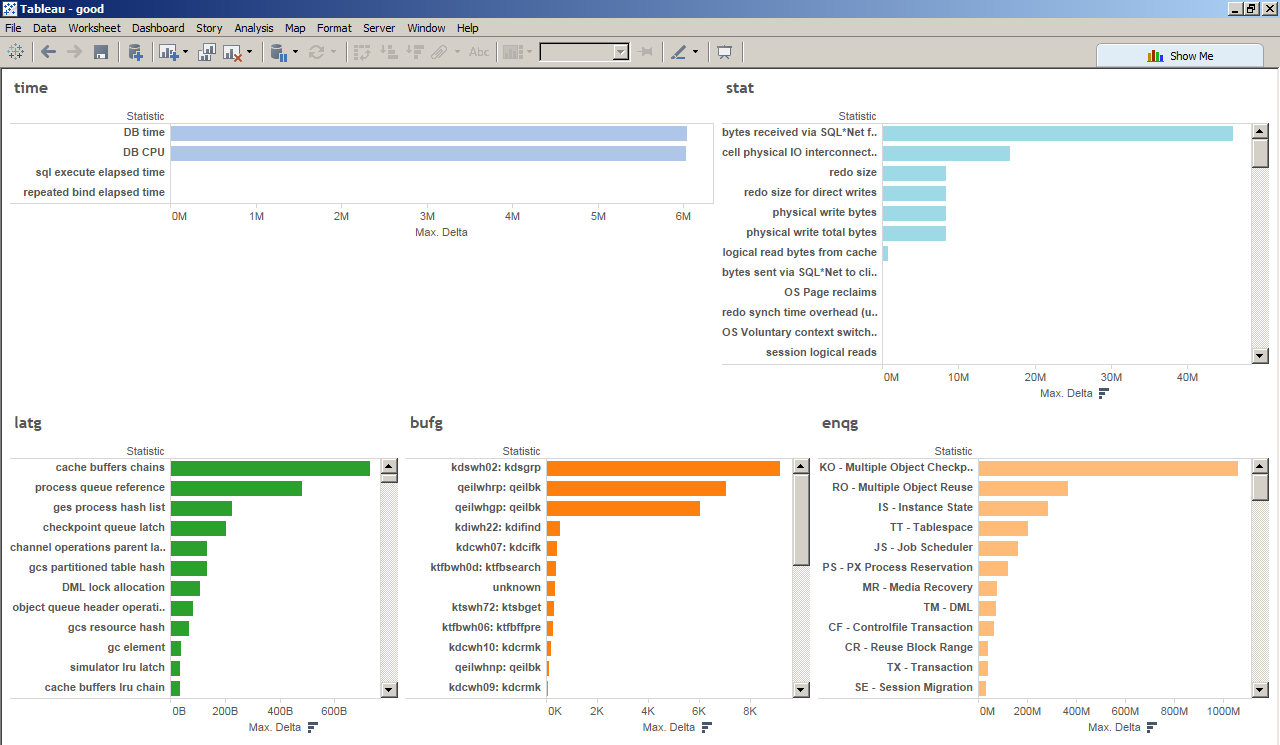
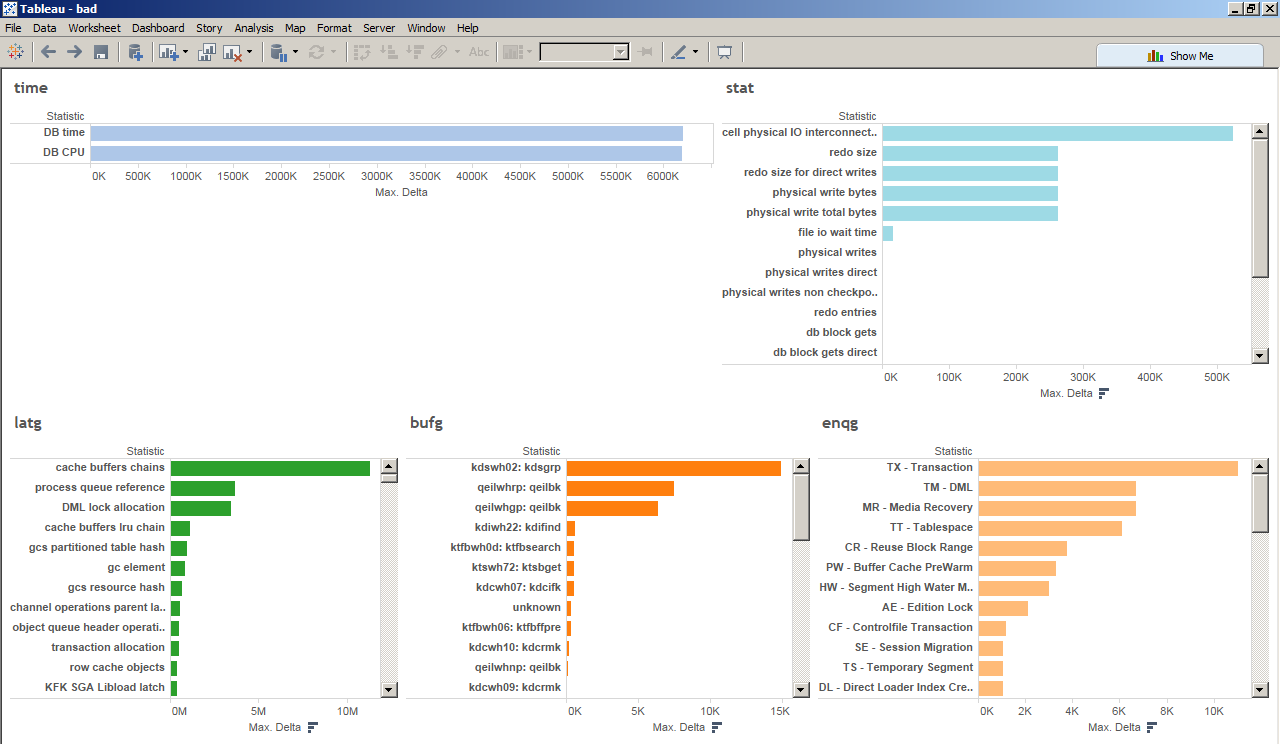
and an example scenario is shown here -> LIO instrumentation, gather=a
(latch, enqueue, buffer gets where) http://bit.ly/1Uhparn
Sample viz on the URL are here
https://raw.githubusercontent.com/karlarao/blog/82d44c4578e610044eef25f62b6c25d4ffb181b7/images/20160427_lios/good.png
https://raw.githubusercontent.com/karlarao/blog/82d44c4578e610044eef25f62b6c25d4ffb181b7/images/20160427_lios/bad.png
-Karl
On Mon, Apr 25, 2016 at 1:10 PM, Jessica Mason <jessica.masson85@xxxxxxxxx>
wrote:
Hello List,
Last week, I was involved in a production issue, where a data load job,
which normally takes few hours to complete, had been running for more than
48 hours. I tried to take the following systematic approach to identify the
cause -
Step 1 - Identify the session and started profiling it. All the time, the
session was on CPU.
Step 2 - To understand why the session was burning CPU, the v$sesstat view
was queried and below were the top statistics that were changing :
43126075162624 logical read bytes from cache
240440566773 table scan rows gotten
2632208820 session logical reads
2632206511 consistent gets
2632206511 consistent gets from cache
2632205708 consistent gets from cache (fastpath)
Step 3 - Next, I wanted to know the object ( table/index) against which
these logical IOs were happening so that I could focus on the operations,
involving these objects, in the execution plan but didn't know which view
to query.
The above information could have saved us lot to time to identify the
cause ( in this case, an unique index was dropped and Oracle was doing FTS
on a table which was referred 6 times in the query fetching million of
records).
So, my questions to the list is that which v$ view should I have checked?
Or is there a better approach to troubleshoot such issues?
Thanks
JM