Re: Difference between CPU and core.
- From: Karl Arao <karlarao@xxxxxxxxx>
- To: prsingh1@xxxxxxxxx
- Date: Mon, 17 Dec 2012 23:23:30 -0600
Just to add..
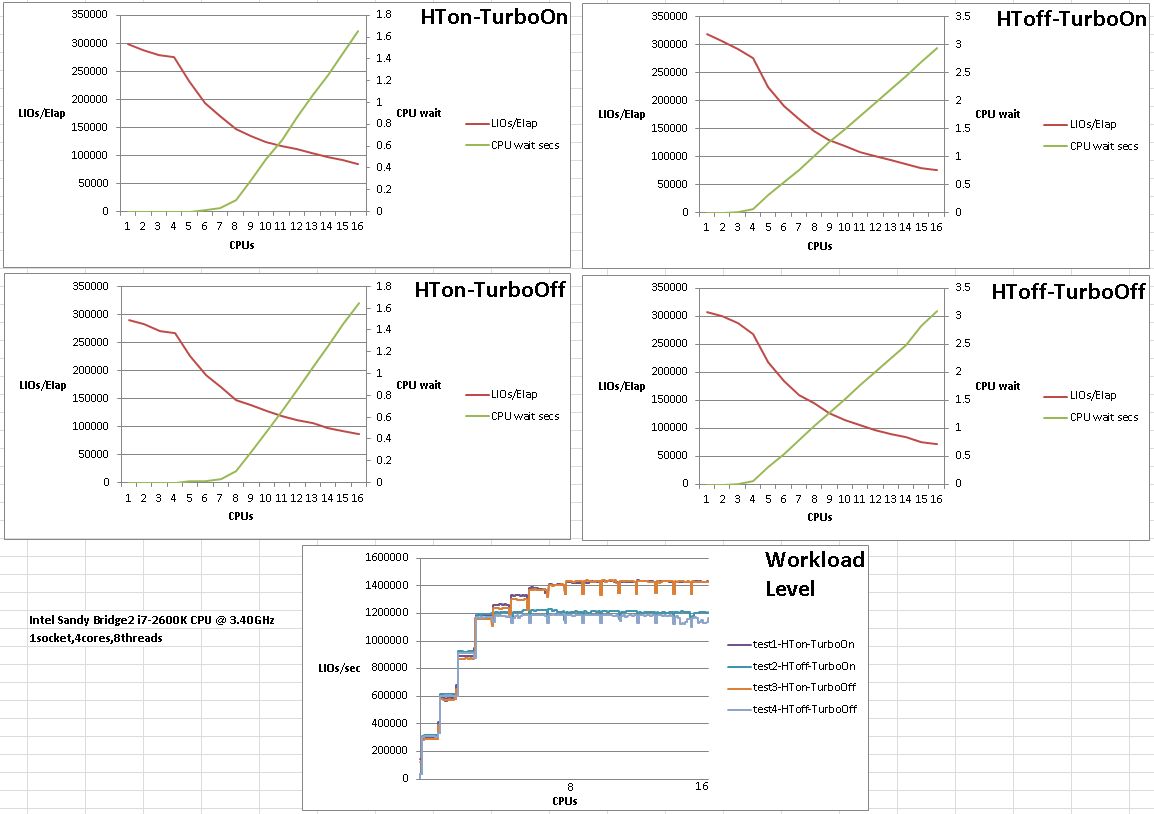
on the example (photo)
https://lh5.googleusercontent.com/-oL5_-FgDcjs/UM_yHxBiquI/AAAAAAAABxo/4GR4QFGDhn4/s2048/threadsVScores.png
the narration of the graph would be like this:
On the HTonTurboOn test case.. the x axis 14 saturated CPUs has y axis
value of about 100,000 LIOs/Elap which means on the workload level
the LIOs/sec
range is about 14 x 100,000 = 1400000 but at this point I'm consuming part
of my response time on CPU wait (run queue) for 1.2secs per execution (from
2.76 total elapsed.. not shown on graph)
--
Karl Arao
karlarao.wordpress.com
karlarao.tiddlyspot.com
twitter.com/karlarao
--
//www.freelists.org/webpage/oracle-l
Other related posts: