[argyllcms] Re: Of ink limiting and maximizing gamut
- From: "Alastair M. Robinson" <profiling@xxxxxxxxxxxxxxxxxxxxxxx>
- To: argyllcms@xxxxxxxxxxxxx
- Date: Wed, 28 Jan 2009 23:04:39 +0000
Hi :)

Thanks for the reply :)

Martin Weberg wrote:
To my experience on proofing paper, an a/b plot on each CMY color tend
to curve (or L plot plateau for K) well before any paper saturation
occurs.
That's actually what I was expecting to see - a plateau in L* but I
haven't seen that effect on this paper (Epson's thin matte Photo Quality
Inkjet Paper).
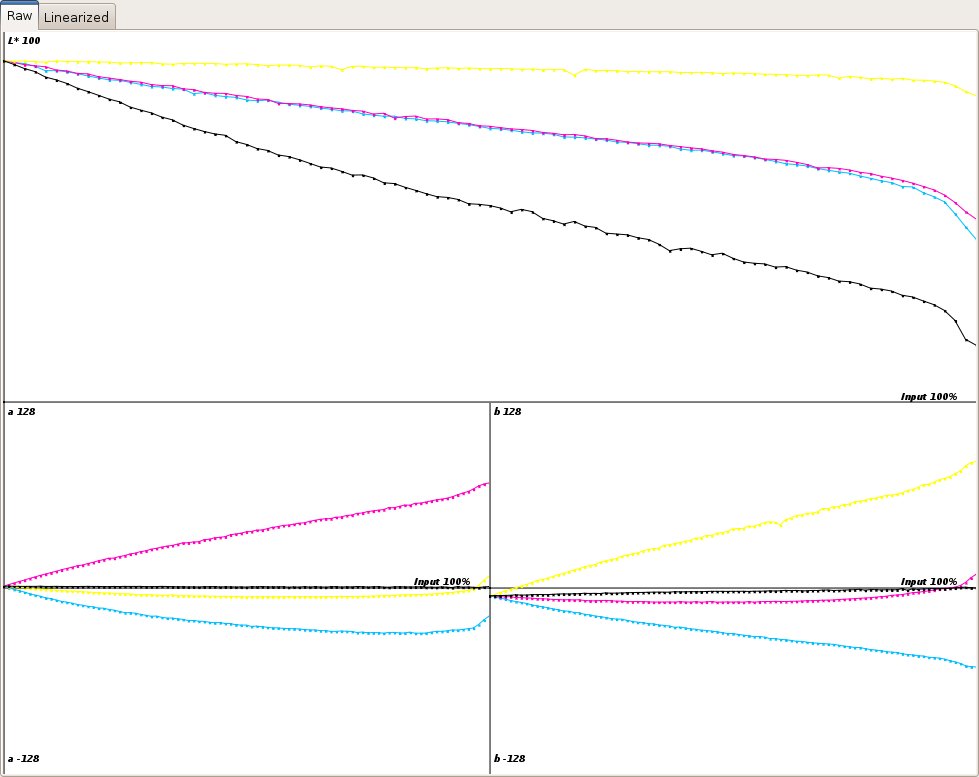
Here's a raw plot of a CMYK stepwedge testchart - plotting input against
L*, a and b. Note that there's already a pretty hefty (modified) gamma
correction going on just to bring the stepwedge testpoints to something
approaching even spacing - maybe this is hiding effects that might
otherwise be visible?
http://www.blackfiveimaging.co.uk/linearize/EpsonPQI_raw.jpg
Maybe you are putting on too much ink per color to begin with?
Have you done a/b plots for CMY colors and L plot for K?
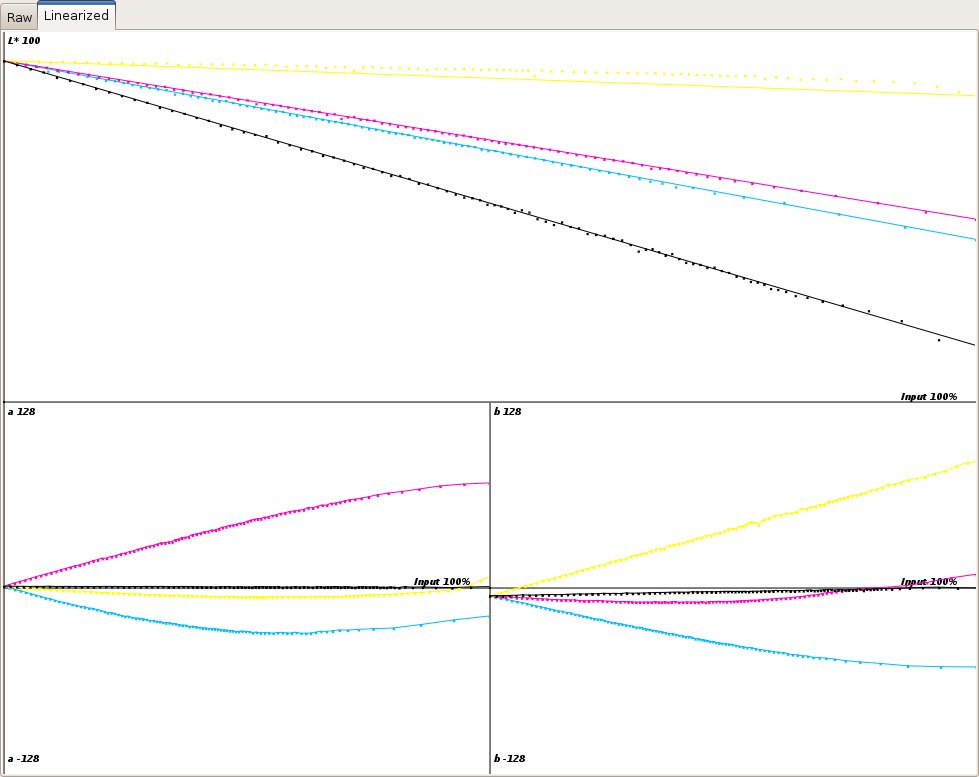
Yup - here's another one, this time with the points' positions adjusted
according to the linearization curve.
http://www.blackfiveimaging.co.uk/linearize/EpsonPQI_lin.jpg
The a/b curves for each colour do curve significantly - except for the
yellow one (since the yellow correction curve is calculated against b,
rather than L*).
I have to admit I've been looking more closely at L* than a/b for signs
of over-inking. How much of the a/b curvature here, I wonder, is down
to over-inking, or does the fact that a given hue doesn't necessarily
have totally constant hue angle in L*ab space have anything to do with
it? (As per the infamous blue-turns-purple problem)
This is the basics and maybe you've already tried it :-)
Some of it, anyway :)
I suppose the crux of my question is really why
super-saturated-colorants-and-super-dense-black-but-low-ink-limit
performs so much worse in terms of overall gamut than
restricted-saturation-of-colorants-but-higher-ink-limits. I guess just
that's an unusual scenario, and thus the tools aren't really geared up
for it?
All the best,
--
Alastair M. Robinson
Other related posts: